Failed 2D & Failed 2U BarsI created this indicator to plot a triangle when a candle is either 1) a failed 2 down--the candle breaks the low of the prior candle but closes green (or higher than its opening price) and doesn't break the high of the previous candle; and 2) a failed 2 up--high of the prior candle is broken but the bar is red and does not break the low of the prior candle.
It has alerts which you can set up in the alert system.
I think that this candle is one of the most telling and powerful when it comes to candle analysis.
R.I.P. Rob Smith, Creator of The Strat.
在腳本中搜尋"the strat"
Dynamic Ticks Oscillator Model (DTOM)The Dynamic Ticks Oscillator Model (DTOM) is a systematic trading approach grounded in momentum and volatility analysis, designed to exploit behavioral inefficiencies in the equity markets. It focuses on the NYSE Down Ticks, a metric reflecting the cumulative number of stocks trading at a lower price than their previous trade. As a proxy for market sentiment and selling pressure, this indicator is particularly useful in identifying shifts in investor behavior during periods of heightened uncertainty or volatility (Jegadeesh & Titman, 1993).
Theoretical Basis
The DTOM builds on established principles of momentum and mean reversion in financial markets. Momentum strategies, which seek to capitalize on the persistence of price trends, have been shown to deliver significant returns in various asset classes (Carhart, 1997). However, these strategies are also susceptible to periods of drawdown due to sudden reversals. By incorporating volatility as a dynamic component, DTOM adapts to changing market conditions, addressing one of the primary challenges of traditional momentum models (Barroso & Santa-Clara, 2015).
Sentiment and Volatility as Core Drivers
The NYSE Down Ticks serve as a proxy for short-term negative sentiment. Sudden increases in Down Ticks often signal panic-driven selling, creating potential opportunities for mean reversion. Behavioral finance studies suggest that investor overreaction to negative news can lead to temporary mispricings, which systematic strategies can exploit (De Bondt & Thaler, 1985). By incorporating a rate-of-change (ROC) oscillator into the model, DTOM tracks the momentum of Down Ticks over a specified lookback period, identifying periods of extreme sentiment.
In addition, the strategy dynamically adjusts entry and exit thresholds based on recent volatility. Research indicates that incorporating volatility into momentum strategies can enhance risk-adjusted returns by improving adaptability to market conditions (Moskowitz, Ooi, & Pedersen, 2012). DTOM uses standard deviations of the ROC as a measure of volatility, allowing thresholds to contract during calm markets and expand during turbulent ones. This approach helps mitigate false signals and aligns with findings that volatility scaling can improve strategy robustness (Barroso & Santa-Clara, 2015).
Practical Implications
The DTOM framework is particularly well-suited for systematic traders seeking to exploit behavioral inefficiencies while maintaining adaptability to varying market environments. By leveraging sentiment metrics such as the NYSE Down Ticks and combining them with a volatility-adjusted momentum oscillator, the strategy addresses key limitations of traditional trend-following models, such as their lagging nature and susceptibility to reversals in volatile conditions.
References
• Barroso, P., & Santa-Clara, P. (2015). Momentum Has Its Moments. Journal of Financial Economics, 116(1), 111–120.
• Carhart, M. M. (1997). On Persistence in Mutual Fund Performance. The Journal of Finance, 52(1), 57–82.
• De Bondt, W. F., & Thaler, R. (1985). Does the Stock Market Overreact? The Journal of Finance, 40(3), 793–805.
• Jegadeesh, N., & Titman, S. (1993). Returns to Buying Winners and Selling Losers: Implications for Stock Market Efficiency. The Journal of Finance, 48(1), 65–91.
• Moskowitz, T. J., Ooi, Y. H., & Pedersen, L. H. (2012). Time Series Momentum. Journal of Financial Economics, 104(2), 228–250.

Turn of the Month Strategy on Steroids█ STRATEGY DESCRIPTION
The "Turn of the Month Strategy on Steroids" is a seasonal mean-reversion strategy designed to capitalize on price movements around the end of the month. It enters a long position when specific conditions are met and exits when the Relative Strength Index (RSI) indicates overbought conditions. This strategy is optimized for use on daily or higher timeframes.
█ WHAT IS THE TURN OF THE MONTH EFFECT?
The Turn of the Month effect refers to the observed tendency of stock prices to rise around the end of the month. This strategy leverages this phenomenon by entering long positions when the price shows signs of a reversal during this period.
█ SIGNAL GENERATION
1. LONG ENTRY
A Buy Signal is triggered when:
The current day of the month is greater than or equal to the specified `dayOfMonth` threshold (default is 25).
The close price is lower than the previous day's close (`close < close `).
The previous day's close is also lower than the close two days ago (`close < close `).
The signal occurs within the specified time window (between `Start Time` and `End Time`).
There is no existing open position (`strategy.position_size == 0`).
2. EXIT CONDITION
A Sell Signal is generated when the 2-period RSI exceeds 65, indicating overbought conditions. This prompts the strategy to exit the position.
█ ADDITIONAL SETTINGS
Day of Month: The day of the month threshold for triggering a Buy Signal. Default is 25.
Start Time and End Time: The time window during which the strategy is allowed to execute trades.
█ PERFORMANCE OVERVIEW
This strategy is designed to exploit seasonal price patterns around the end of the month.
It performs best in markets where the Turn of the Month effect is pronounced.
Backtesting results should be analyzed to optimize the `dayOfMonth` threshold and RSI parameters for specific instruments.

Hull Suite by MRS**Hull Suite by MRS Strategy Indicator**
The Hull Suite by MRS Strategy is a technical analysis tool designed to provide insights into market trends using variations of the Hull Moving Average (HMA). This strategy aims to help traders identify optimal entry points for both long and short positions by utilizing multiple types of Hull-based indicators.
### Key Features:
1. **Hull Moving Average Variations**: The indicator offers three different Hull Moving Average variants:
- **HMA (Hull Moving Average)**: A fast-moving average that minimizes lag and reacts quickly to price changes.
- **EHMA (Enhanced Hull Moving Average)**: A smoother version of HMA with reduced noise, offering a clearer view of market trends.
- **THMA (Triple Hull Moving Average)**: A more complex Hull average that aims to provide a stronger confirmation of trend direction.
2. **Customizable Parameters**:
- **Source Selection**: Allows traders to choose the source for calculation (e.g., closing prices).
- **Length**: A configurable parameter to adjust the period over which the moving average is calculated (e.g., 55-period for swing entries).
- **Trend Coloring**: Users can enable automatic color-coding of the Hull moving average to reflect whether the market is in an uptrend (green) or downtrend (red).
- **Candle Color**: Option to color candles based on Hull's trend, further improving the visual clarity of trend direction.
3. **Entry and Exit Signals**:
- **Buy Signal**: Generated when the Hull moving average crosses above its historical value, indicating a potential upward price movement.
- **Sell Signal**: Triggered when the Hull moving average crosses below its historical value, signaling a potential downward price movement.
- The strategy can be customized to work with long, short, or both directions, making it adaptable for various market conditions.
4. **Visual Representation**:
- **Hull Bands**: The indicator can plot the Hull moving average as bands, with customizable transparency to suit individual preferences.
- **Band Filler**: The area between the two Hull moving averages is filled, making it easier to identify trends at a glance.
5. **Backtesting and Strategy Execution**: This strategy can be tested on historical data with adjustable backtest start and stop dates, providing traders with a better understanding of its performance before live trading.
### Purpose:
The Hull Suite by MRS Strategy is designed to assist traders in determining the optimal time to enter and exit the market based on robust Hull moving averages. With its flexibility, it can be used for trend-following, swing trading, or other strategic applications.

EMA Crossover Strategy with Take Profit and Candle HighlightingStrategy Overview:
This strategy is based on the Exponential Moving Averages (EMA), specifically the EMA 20 and EMA 50. It takes advantage of EMA crossovers to identify potential trend reversals and uses multiple take-profit levels and a stop-loss for risk management.
Key Components:
EMA Crossover Signals:
Buy Signal (Uptrend): A buy signal is generated when the EMA 20 crosses above the EMA 50, signaling the start of a potential uptrend.
Sell Signal (Downtrend): A sell signal is generated when the EMA 20 crosses below the EMA 50, signaling the start of a potential downtrend.
Take Profit Levels:
Once a buy or sell signal is triggered, the strategy calculates multiple take-profit levels based on the range of the previous candle. The user can define multipliers for each take-profit level.
Take Profit 1 (TP1): 50% of the previous candle's range above or below the entry price.
Take Profit 2 (TP2): 100% of the previous candle's range above or below the entry price.
Take Profit 3 (TP3): 150% of the previous candle's range above or below the entry price.
Take Profit 4 (TP4): 200% of the previous candle's range above or below the entry price.
These levels are adjusted dynamically based on the previous candle's high and low, so they adapt to changing market conditions.
Stop Loss:
A stop-loss is set to manage risk. The default stop-loss is 3% from the entry price, but this can be adjusted in the settings. The stop-loss is triggered if the price moves against the position by this amount.
Trend Direction Highlighting:
The strategy highlights the bars (candles) with colors:
Green bars indicate an uptrend (when EMA 20 crosses above EMA 50).
Red bars indicate a downtrend (when EMA 20 crosses below EMA 50).
These visual cues help users easily identify the market direction.
Strategy Entries and Exits:
Entries: The strategy enters a long (buy) position when the EMA 20 crosses above the EMA 50 and a short (sell) position when the EMA 20 crosses below the EMA 50.
Exits: The strategy exits the positions at any of the defined take-profit levels or the stop-loss. Multiple exit levels provide opportunities to take profit progressively as the price moves in the favorable direction.
Entry and Exit Conditions in Detail:
Buy Entry Condition (Uptrend):
A buy position is opened when EMA 20 crosses above EMA 50, signaling the start of an uptrend.
The strategy calculates take-profit levels above the entry price based on the previous bar's range (high-low) and the multipliers for TP1, TP2, TP3, and TP4.
Sell Entry Condition (Downtrend):
A sell position is opened when EMA 20 crosses below EMA 50, signaling the start of a downtrend.
The strategy calculates take-profit levels below the entry price, similarly based on the previous bar's range.
Exit Conditions:
Take Profit: The strategy attempts to exit the position at one of the take-profit levels (TP1, TP2, TP3, or TP4). If the price reaches any of these levels, the position is closed.
Stop Loss: The strategy also has a stop-loss set at a default value (3% below the entry for long trades, and 3% above for short trades). The stop-loss helps to protect the position from significant losses.
Backtesting and Performance Metrics:
The strategy can be backtested using TradingView's Strategy Tester. The results will show how the strategy would have performed historically, including key metrics like:
Net Profit
Max Drawdown
Win Rate
Profit Factor
Average Trade Duration
These performance metrics can help users assess the strategy's effectiveness over historical periods and optimize the input parameters (e.g., multipliers, stop-loss level).
Customization:
The strategy allows for the adjustment of several key input values via the settings panel:
Take Profit Multipliers: Users can customize the multipliers for each take-profit level (TP1, TP2, TP3, TP4).
Stop Loss Percentage: The user can also adjust the stop-loss percentage to a custom value.
EMA Periods: The default periods for the EMA 50 and EMA 20 are fixed, but they can be adjusted for different market conditions.
Pros of the Strategy:
EMA Crossover Strategy: A classic and well-known strategy used by traders to identify the start of new trends.
Multiple Take Profit Levels: By taking profits progressively at different levels, the strategy locks in gains as the price moves in favor of the position.
Clear Trend Identification: The use of green and red bars makes it visually easier to follow the market's direction.
Risk Management: The stop-loss and take-profit features help to manage risk and optimize profit-taking.
Cons of the Strategy:
Lagging Indicators: The strategy relies on EMAs, which are lagging indicators. This means that the strategy might enter trades after the trend has already started, leading to missed opportunities or less-than-ideal entry prices.
No Confirmation Indicators: The strategy purely depends on the crossover of two EMAs and does not use other confirming indicators (e.g., RSI, MACD), which might lead to false signals in volatile markets.
How to Use in Real-Time Trading:
Use for Backtesting: Initially, use this strategy in backtest mode to understand how it would have performed historically with your preferred settings.
Paper Trading: Once comfortable, you can use paper trading to test the strategy in real-time market conditions without risking real money.
Live Trading: After testing and optimizing the strategy, you can consider using it for live trading with proper risk management in place (e.g., starting with a small position size and adjusting parameters as needed).
Summary:
This strategy is designed to identify trend reversals using EMA crossovers, with customizable take-profit levels and a stop-loss to manage risk. It's well-suited for traders looking for a systematic way to enter and exit trades based on clear market signals, while also providing flexibility to adjust for different risk profiles and trading styles.

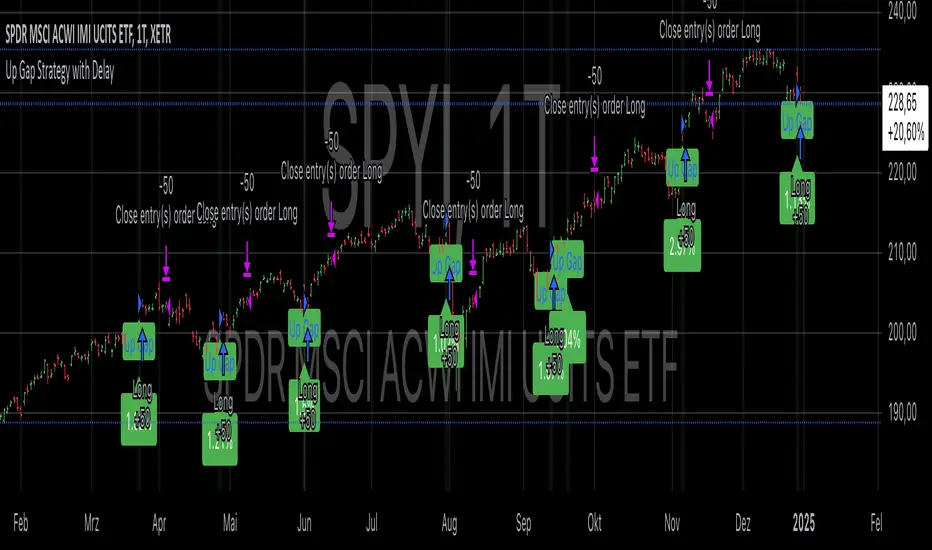
Up Gap Strategy with DelayThis strategy, titled “Up Gap Strategy with Delay,” is based on identifying up gaps in the price action of an asset. A gap is defined as the percentage difference between the current bar’s open price and the previous bar’s close price. The strategy triggers a long position if the gap exceeds a user-defined threshold and includes a delay period before entering the position. After entering, the position is held for a set number of periods before being closed.
Key Features:
1. Gap Threshold: The strategy defines an up gap when the gap size exceeds a specified threshold (in percentage terms). The gap threshold is an input parameter that allows customization based on the user’s preference.
2. Delay Period: After the gap occurs, the strategy waits for a delay period before initiating a long position. This delay can help mitigate any short-term volatility that might occur immediately after the gap.
3. Holding Period: Once the position is entered, it is held for a user-defined number of periods (holdingPeriods). This is to capture the potential post-gap trend continuation, as gaps often indicate strong directional momentum.
4. Gap Plotting: The strategy visually plots up gaps on the chart by placing a green label beneath the bar where the gap condition is met. Additionally, the background color turns green to highlight up-gap occurrences.
5. Exit Condition: The position is exited after the defined holding period. The strategy ensures that the position is closed after this time, regardless of whether the price is in profit or loss.
Scientific Background:
The gap theory has been widely studied in financial literature and is based on the premise that gaps in price often represent areas of significant support or resistance. According to research by Kaufman (2002), gaps in price action can be indicators of future price direction, particularly when they occur after a period of consolidation or a trend reversal. Moreover, Gaps and their Implications in Technical Analysis (Murphy, 1999) highlights that gaps can reflect imbalances between supply and demand, leading to high momentum and potential price continuation or reversal.
In trading strategies, utilizing gaps with specific conditions, such as delay and holding periods, can enhance the ability to capture significant price moves. The strategy’s delay period helps avoid potential market noise immediately after the gap, while the holding period seeks to capitalize on the price continuation that often follows gap formation.
This methodology aligns with momentum-based strategies, which rely on the persistence of trends in financial markets. Several studies, including Jegadeesh & Titman (1993), have documented the existence of momentum effects in stock prices, where past price movements can be predictive of future returns.
Conclusion:
This strategy incorporates gap detection and momentum principles, supported by empirical research in technical analysis, to attempt to capitalize on price movements following significant gaps. By waiting for a delay period and holding the position for a specified time, it aims to mitigate the risk associated with early volatility while maximizing the potential for sustained price moves.
Moving Average Crossover Strategy with Take Profit and Stop LossThe Moving Average Crossover Strategy is a popular trading technique that utilizes two moving averages (MAs) of different periods to identify potential buy and sell signals. By incorporating take profit and stop loss levels, traders can effectively manage their risk while maximizing potential returns. Here’s a detailed explanation of how this strategy works:
Overview of the Moving Average Crossover Strategy
Moving Averages:
A short-term moving average (e.g., 50-day MA) reacts more quickly to price changes, while a long-term moving average (e.g., 200-day MA) smooths out price fluctuations over a longer period.
The strategy generates trading signals based on the crossover of these two averages:
Buy Signal: When the short-term MA crosses above the long-term MA (often referred to as a "Golden Cross").
Sell Signal: When the short-term MA crosses below the long-term MA (known as a "Death Cross").
Implementing Take Profit and Stop Loss
1. Setting Take Profit Levels
Definition: A take profit order automatically closes a trade when it reaches a specified profit level.
Strategy:
Determine a realistic profit target based on historical price action, support and resistance levels, or a fixed risk-reward ratio (e.g., 2:1).
For instance, if you enter a buy position at $100, you might set a take profit at $110 if you anticipate that level will act as resistance.
2. Setting Stop Loss Levels
Definition: A stop loss order limits potential losses by closing a trade when the price reaches a specified level.
Strategy:
Place the stop loss just below the most recent swing low for buy orders or above the recent swing high for sell orders.
Alternatively, you can use a percentage-based method (e.g., 2-3% below the entry point) to define your stop loss.
For example, if you enter a buy position at $100 with a stop loss set at $95, your maximum loss would be limited to $5 per share.
Example of Using Moving Average Crossover with Take Profit and Stop Loss
Entry Signal:
You observe that the 50-day MA crosses above the 200-day MA at $100. You enter a buy position.
Setting Take Profit and Stop Loss:
You analyze historical price levels and set your take profit at $110.
You place your stop loss at $95 based on recent swing lows.
Trade Management:
If the price rises to $110, your take profit order is executed, securing your profit.
If the price falls to $95, your stop loss is triggered, limiting your losses.

Trend Trader-Remastered StrategyOfficial Strategy for Trend Trader - Remastered
Indicator: Trend Trader-Remastered (TTR)
Overview:
The Trend Trader-Remastered is a refined and highly sophisticated implementation of the Parabolic SAR designed to create strategic buy and sell entry signals, alongside precision take profit and re-entry signals based on marked Bill Williams (BW) fractals. Built with a deep emphasis on clarity and accuracy, this indicator ensures that only relevant and meaningful signals are generated, eliminating any unnecessary entries or exits.
Please check the indicator details and updates via the link above.
Important Disclosure:
My primary objective is to provide realistic strategies and a code base for the TradingView Community. Therefore, the default settings of the strategy version of the indicator have been set to reflect realistic world trading scenarios and best practices.
Key Features:
Strategy execution date&time range.
Take Profit Reduction Rate: The percentage of progressive reduction on active position size for take profit signals.
Example:
TP Reduce: 10%
Entry Position Size: 100
TP1: 100 - 10 = 90
TP2: 90 - 9 = 81
Re-Entry When Rate: The percentage of position size on initial entry of the signal to determine re-entry.
Example:
RE When: 50%
Entry Position Size: 100
Re-Entry Condition: Active Position Size < 50
Re-Entry Fill Rate: The percentage of position size on initial entry of the signal to be completed.
Example:
RE Fill: 75%
Entry Position Size: 100
Active Position Size: 50
Re-Entry Order Size: 25
Final Active Position Size:75
Important: Even RE When condition is met, the active position size required to drop below RE Fill rate to trigger re-entry order.
Key Points:
'Process Orders on Close' is enabled as Take Profit and Re-Entry signals must be executed on candle close.
'Calculate on Every Tick' is enabled as entry signals are required to be executed within candle time.
'Initial Capital' has been set to 10,000 USD.
'Default Quantity Type' has been set to 'Percent of Equity'.
'Default Quantity' has been set to 10% as the best practice of investing 10% of the assets.
'Currency' has been set to USD.
'Commission Type' has been set to 'Commission Percent'
'Commission Value' has been set to 0.05% to reflect the most realistic results with a common taker fee value.

R-based Strategy Template [Daveatt]Have you ever wondered how to properly track your trading performance based on risk rather than just profits?
This template solves that problem by implementing R-multiple tracking directly in TradingView's strategy tester.
This script is a tool that you must update with your own trading entry logic.
Quick notes
Before we dive in, I want to be clear: this is a template focused on R-multiple calculation and visualization.
I'm using a basic RSI strategy with dummy values just to demonstrate how the R tracking works. The actual trading signals aren't important here - you should replace them with your own strategy logic.
R multiple logic
Let's talk about what R-multiple means in practice.
Think of R as your initial risk per trade.
For instance, if you have a $10,000 account and you're risking 1% per trade, your 1R would be $100.
A trade that makes twice your risk would be +2R ($200), while hitting your stop loss would be -1R (-$100).
This way of measuring makes it much easier to evaluate your strategy's performance regardless of account size.
Whenever the SL is hit, we lose -1R
Proof showing the strategy tester whenever the SL is hit: i.imgur.com
The magic happens in how we calculate position sizes.
The script automatically determines the right position size to risk exactly your specified percentage on each trade.
This is done through a simple but powerful calculation:
risk_amount = (strategy.equity * (risk_per_trade_percent / 100))
sl_distance = math.abs(entry_price - sl_price)
position_size = risk_amount / (sl_distance * syminfo.pointvalue)
Limitations with lower timeframe gaps
This ensures that if your stop loss gets hit, you'll lose exactly the amount you intended to risk. No more, no less.
Well, could be more or less actually ... let's assume you're trading futures on a 15-minute chart but in the 1-minute chart there is a gap ... then your 15 minute SL won't get filled and you'll likely to not lose exactly -1R
This is annoying but it can't be fixed - and that's how trading works anyway.
Features
The template gives you flexibility in how you set your stop losses. You can use fixed points, ATR-based stops, percentage-based stops, or even tick-based stops.
Regardless of which method you choose, the position sizing will automatically adjust to maintain your desired risk per trade.
To help you track performance, I've added a comprehensive statistics table in the top right corner of your chart.
It shows you everything you need to know about your strategy's performance in terms of R-multiples: how many R you've won or lost, your win rate, average R per trade, and even your longest winning and losing streaks.
Happy trading!
And remember, measuring your performance in R-multiples is one of the most classical ways to evaluate and improve your trading strategies.
Daveatt

Smart DCA Strategy (Public)INSPIRATION
While Dollar Cost Averaging (DCA) is a popular and stress-free investment approach, I noticed an opportunity for enhancement. Standard DCA involves buying consistently, regardless of market conditions, which can sometimes mean missing out on optimal investment opportunities. This led me to develop the Smart DCA Strategy – a 'set and forget' method like traditional DCA, but with an intelligent twist to boost its effectiveness.
The goal was to build something more profitable than a standard DCA strategy so it was equally important that this indicator could backtest its own results in an A/B test manner against the regular DCA strategy.
WHY IS IT SMART?
The key to this strategy is its dynamic approach: buying aggressively when the market shows signs of being oversold, and sitting on the sidelines when it's not. This approach aims to optimize entry points, enhancing the potential for better returns while maintaining the simplicity and low stress of DCA.
WHAT THIS STRATEGY IS, AND IS NOT
This is an investment style strategy. It is designed to improve upon the common standard DCA investment strategy. It is therefore NOT a day trading strategy. Feel free to experiment with various timeframes, but it was designed to be used on a daily timeframe and that's how I recommend it to be used.
You may also go months without any buy signals during bull markets, but remember that is exactly the point of the strategy - to keep your buying power on the sidelines until the markets have significantly pulled back. You need to be patient and trust in the historical backtesting you have performed.
HOW IT WORKS
The Smart DCA Strategy leverages a creative approach to using Moving Averages to identify the most opportune moments to buy. A trigger occurs when a daily candle, in its entirety including the high wick, closes below the threshold line or box plotted on the chart. The indicator is designed to facilitate both backtesting and live trading.
HOW TO USE
Settings:
The input parameters for tuning have been intentionally simplified in an effort to prevent users falling into the overfitting trap.
The main control is the Buying strictness scale setting. Setting this to a lower value will provide more buying days (less strict) while higher values mean less buying days (more strict). In my testing I've found level 9 to provide good all round results.
Validation days is a setting to prevent triggering entries until the asset has spent a given number of days (candles) in the overbought state. Increasing this makes entries stricter. I've found 0 to give the best results across most assets.
In the backtest settings you can also configure how much to buy for each day an entry triggers. Blind buy size is the amount you would buy every day in a standard DCA strategy. Smart buy size is the amount you would buy each day a Smart DCA entry is triggered.
You can also experiment with backtesting your strategy over different historical datasets by using the Start date and End date settings. The results table will not calculate for any trades outside what you've set in the date range settings.
Backtesting:
When backtesting you should use the results table on the top right to tune and optimise the results of your strategy. As with all backtests, be careful to avoid overfitting the parameters. It's better to have a setup which works well across many currencies and historical periods than a setup which is excellent on one dataset but bad on most others. This gives a much higher probability that it will be effective when you move to live trading.
The results table provides a clear visual representation as to which strategy, standard or smart, is more profitable for the given dataset. You will notice the columns are dynamically coloured red and green. Their colour changes based on which strategy is more profitable in the A/B style backtest - green wins, red loses. The key metrics to focus on are GOA (Gain on Account) and Avg Cost.
Live Trading:
After you've finished backtesting you can proceed with configuring your alerts for live trading.
But first, you need to estimate the amount you should buy on each Smart DCA entry. We can use the Total invested row in the results table to calculate this. Assuming we're looking to trade on
BTCUSD
Decide how much USD you would spend each day to buy BTC if you were using a standard DCA strategy. Lets say that is $5 per day
Enter that USD amount in the Blind buy size settings box
Check the Blind Buy column in the results table. If we set the backtest date range to the last 10 years, we would expect the amount spent on blind buys over 10 years to be $18,250 given $5 each day
Next we need to tweak the value of the Smart buy size parameter in setting to get it as close as we can to the Total Invested amount for Blind Buy
By following this approach it means we will invest roughly the same amount into our Smart DCA strategy as we would have into a standard DCA strategy over any given time period.
After you have calculated the Smart buy size, you can go ahead and set up alerts on Smart DCA buy triggers.
BOT AUTOMATION
In an effort to maintain the 'set and forget' stress-free benefits of a standard DCA strategy, I have set my personal Smart DCA Strategy up to be automated. The bot runs on AWS and I have a fully functional project for the bot on my GitHub account. Just reach out if you would like me to point you towards it. You can also hook this into any other 3rd party trade automation system of your choice using the pre-configured alerts within the indicator.
PLANNED FUTURE DEVELOPMENTS
Currently this is purely an accumulation strategy. It does not have any sell signals right now but I have ideas on how I will build upon it to incorporate an algorithm for selling. The strategy should gradually offload profits in bull markets which generates more USD which gives more buying power to rinse and repeat the same process in the next cycle only with a bigger starting capital. Watch this space!
MARKETS
Crypto:
This strategy has been specifically built to work on the crypto markets. It has been developed, backtested and tuned against crypto markets and I personally only run it on crypto markets to accumulate more of the coins I believe in for the long term. In the section below I will provide some backtest results from some of the top crypto assets.
Stocks:
I've found it is generally more profitable than a standard DCA strategy on the majority of stocks, however the results proved to be a lot more impressive on crypto. This is mainly due to the volatility and cycles found in crypto markets. The strategy makes its profits from capitalising on pullbacks in price. Good stocks on the other hand tend to move up and to the right with less significant pullbacks, therefore giving this strategy less opportunity to flourish.
Forex:
As this is an accumulation style investment strategy, I do not recommend that you use it to trade Forex.
For more info about this strategy including backtest results, please see the full description on the invite only version of this strategy named "Smart DCA Strategy"

MACD Aggressive Scalp SimpleComment on the Script
Purpose and Structure:
The script is a scalping strategy based on the MACD indicator combined with EMA (50) as a trend filter.
It uses the MACD histogram's crossover/crossunder of zero to trigger entries and exits, allowing the trader to capitalize on short-term momentum shifts.
The use of strategy.close ensures that positions are closed when specified conditions are met, although adjustments were made to align with Pine Script version 6.
Strengths:
Simplicity and Clarity: The logic is straightforward and focuses on essential scalping principles (momentum-based entries and exits).
Visual Indicators: The plotted MACD line, signal line, and histogram columns provide clear visual feedback for the strategy's operation.
Trend Confirmation: Incorporating the EMA(50) as a trend filter helps avoid trades that go against the prevailing trend, reducing the likelihood of false signals.
Dynamic Exit Conditions: The conditional logic for closing positions based on weakening momentum (via MACD histogram change) is a good way to protect profits or minimize losses.
Potential Improvements:
Parameter Inputs:
Make the MACD (12, 26, 9) and EMA(50) values adjustable by the user through input statements for better customization during backtesting.
Example:
pine
Copy code
macdFast = input(12, title="MACD Fast Length")
macdSlow = input(26, title="MACD Slow Length")
macdSignal = input(9, title="MACD Signal Line Length")
emaLength = input(50, title="EMA Length")
Stop Loss and Take Profit:
The strategy currently lacks explicit stop-loss or take-profit levels, which are critical in a scalping strategy to manage risk and lock in profits.
ATR-based or fixed-percentage exits could be added for better control.
Position Size and Risk Management:
While the script uses 50% of equity per trade, additional options (e.g., fixed position sizes or risk-adjusted sizes) would be beneficial for flexibility.
Avoid Overlapping Signals:
Add logic to prevent overlapping signals (e.g., opening a new position immediately after closing one on the same bar).
Backtesting Optimization:
Consider adding labels or markers (label.new or plotshape) to visualize entry and exit points on the chart for better debugging and analysis.
The inclusion of performance metrics like max drawdown, Sharpe ratio, or profit factor would help assess the strategy's robustness during backtesting.
Compatibility with Live Trading:
The strategy could be further enhanced with alert conditions using alertcondition to notify the trader of buy/sell signals in real-time.

Hybrid Triple Exponential Smoothing🙏🏻 TV, I present you HTES aka Hybrid Triple Exponential Smoothing, designed by Holt & Winters in the US, assembled by me in Saint P. I apply exponential smoothing individually to the data itself, then to residuals from the fitted values, and lastly to one-point forecast (OPF) errors, hence 'hybrid'. At the same time, the method is a closed-form solution and purely online, no need to make any recalculations & optimize anything, so the method is O(1).
^^ historical OPFs and one-point forecasting interval plotted instead of fitted values and prediction interval
Before the How-to, first let me tell you some non-obvious things about Triple Exponential smoothing (and about Exponential Smoothing in general) that not many catch. Expo smoothing seems very straightforward and obvious, but if you look deeper...
1) The whole point of exponential smoothing is its incremental/online nature, and its O(1) algorithm complexity, making it dope for high-frequency streaming data that is also univariate and has no weights. Consequently:
- Any hybrid models that involve expo smoothing and any type of ML models like gradient boosting applied to residuals rarely make much sense business-wise: if you have resources to boost the residuals, you prolly have resources to use something instead of expo smoothing;
- It also concerns the fashion of using optimizers to pick smoothing parameters; honestly, if you use this approach, you have to retrain on each datapoint, which is crazy in a streaming context. If you're not in a streaming context, why expo smoothing? What makes more sense is either picking smoothing parameters once, guided by exogenous info, or using dynamic ones calculated in a minimalistic and elegant way (more on that in further drops).
2) No matter how 'right' you choose the smoothing parameters, all the resulting components (level, trend, seasonal) are not pure; each of them contains a bit of info from the other components, this is just how non-sequential expo smoothing works. You gotta know this if you wanna use expo smoothing to decompose your time series into separate components. The only pure component there, lol, is the residuals;
3) Given what I've just said, treating the level (that does contain trend and seasonal components partially) as the resulting fit is a mistake. The resulting fit is level (l) + trend (b) + seasonal (s). And from this fit, you calculate residuals;
4) The residuals component is not some kind of bad thing; it is simply the component that contains info you consciously decide not to include in your model for whatever reason;
5) Forecasting Errors and Residuals from fitted values are 2 different things. The former are deltas between the forecasts you've made and actual values you've observed, the latter are simply differences between actual datapoints and in-sample fitted values;
6) Residuals are used for in-sample prediction intervals, errors for out-of-sample forecasting intervals;
7) Choosing between single, double, or triple expo smoothing should not be based exclusively on the nature of your data, but on what you need to do as well. For example:
- If you have trending seasonal data and you wanna do forecasting exclusively within the expo smoothing framework, then yes, you need Triple Exponential Smoothing;
- If you wanna use prediction intervals for generating trend-trading signals and you disregard seasonality, then you need single (simple) expo smoothing, even on trending data. Otherwise, the trend component will be included in your model's fitted values → prediction intervals.
8) Kind of not non-obvious, but when you put one smoothing parameter to zero, you basically disregard this component. E.g., in triple expo smoothing, when you put gamma and beta to zero, you basically end up with single exponential smoothing.
^^ data smoothing, beta and gamma zeroed out, forecasting steps = 0
About the implementation
* I use a simple power transform that results in a log transform with lambda = 0 instead of the mainstream-used transformers (if you put lambda on 2 in Box-Cox, you won't get a power of 2 transform)
* Separate set of smoothing parameters for data, residuals, and errors smoothing
* Separate band multipliers for residuals and errors
* Both typical error and typical residuals get multiplied by math.sqrt(math.pi / 2) in order to approach standard deviation so you can ~use Z values and get more or less corresponding probabilities
* In script settings → style, you can switch on/off plotting of many things that get calculated internally:
- You can visualize separate components (just remember they are not pure);
- You can switch off fit and switch on OPF plotting;
- You can plot residuals and their exponentially smoothed typical value to pick the smoothing parameters for both data and residuals;
- Or you might plot errors and play with data smoothing parameters to minimize them (consult SAE aka Sum of Absolute Errors plot);
^^ nuff said
More ideas on how to use the thing
1) Use Double Exponential Smoothing (data gamma = 0) to detrend your time series for further processing (Fourier likes at least weakly stationary data);
2) Put single expo smoothing on your strategy/subaccount equity chart (data alpha = data beta = 0), set prediction interval deviation multiplier to 1, run your strat live on simulator, start executing on real market when equity on simulator hits upper deviation (prediction interval), stop trading if equity hits lower deviation on simulator. Basically, let the strat always run on simulator, but send real orders to a real market when the strat is successful on your simulator;
3) Set up the model to minimize one-point forecasting errors, put error forecasting steps to 1, now you're doing nowcasting;
4) Forecast noisy trending sine waves for fun.
^^ nuff said 2
All Good TV ∞

BacktestLibraryLibrary "BacktestLibrary"
A library providing functions for equity calculation and performance metrics.
since(date, active)
: Calculates the number of candles since a specified date.
Parameters:
date (simple float) : (simple float): The starting date in timestamp format (e.g., input.time(timestamp()))
active (simple bool) : (simple bool): If true, counts the number of candles since the date; if false, returns 0.
Returns: (int): The number of candles since the specified date.
buy_and_hold(r, startDate)
: Calculates the Buy and Hold Equity from a specified date.
Parameters:
r (float) : (series float): Daily returns of the asset (e.g., 0.02 for 2% move).
startDate (simple float) : (simple float): Timestamp of the starting date for the equity calculation.
Returns: (float): Buy and Hold Equity of the asset from the specified date.
equity(sig, threshold, r, startDate, signals)
: Calculates the strategy's equity on a candle-by-candle basis.
Parameters:
sig (float) : (series float): Signal values; positive for long, negative for short.
threshold (simple float) : (simple float): Signal threshold for entering trades.
r (float) : (series float): Daily returns of the asset (e.g., 0.02 for 2% move).
startDate (simple float) : (simple float): Timestamp of the starting date for the equity calculation.
signals (simple string) : (simple string): Type of signals to backtest ("Long & Short", "Long Only", "Short Only").
Returns: (float): Strategy equity on a candle-by-candle basis.
PerformanceMetrics(base, Lookback, startDate)
: Calculates performance metrics of a strategy from a specified date.
Parameters:
base (float) : (series float): Equity values of the strategy or Buy and Hold equity.
Lookback (int) : (series int): Number of periods since the start date; recommended to use the 'since' function.
startDate (simple float) : (simple float): Timestamp of the starting date for the equity calculation.
Returns: (float ): Array of performance metrics.
PerfMetricTable(buy_and_hold, strategy)
: Plots a table comparing performance metrics of Buy and Hold and Strategy equity.
Parameters:
buy_and_hold (array) : (float ): Metrics from the PerformanceMetrics() function for Buy and Hold.
strategy (array) : (float ): Metrics from the PerformanceMetrics() function for the strategy.
Returns: : Table displaying the performance metrics comparison.

SnowdexUtilsLibrary "SnowdexUtils"
the various function that often use when create a strategy trading.
f_backtesting_date(train_start_date, train_end_date, test_date, deploy_date)
Backtesting within a specific window based on deployment and testing dates.
Parameters:
train_start_date (int) : the start date for training the strategy.
train_end_date (int) : the end date for training the strategy.
test_date (bool) : if true, backtests within the period from `train_end_date` to the current time.
deploy_date (bool) : if true, the strategy backtests up to the current time.
Returns: given time falls within the specified window for backtesting.
f_init_ma(ma_type, source, length)
Initializes a moving average based on the specified type.
Parameters:
ma_type (simple string) : the type of moving average (e.g., "RMA", "EMA", "SMA", "WMA").
source (float) : the input series for the moving average calculation.
length (simple int) : the length of the moving average window.
Returns: the calculated moving average value.
f_init_tp(side, entry_price, rr, sl_open_position)
Calculates the target profit based on entry price, risk-reward ratio, and stop loss. The formula is `tp = entry price + (rr * (entry price - stop loss))`.
Parameters:
side (bool) : the trading side (true for long, false for short).
entry_price (float) : the entry price of the position.
rr (float) : the risk-reward ratio.
sl_open_position (float) : the stop loss price for the open position.
Returns: the calculated target profit value.
f_round_up(number, decimals)
Rounds up a number to a specified number of decimals.
Parameters:
number (float)
decimals (int)
Returns: The rounded-up number.
f_get_pip_size()
Calculates the pip size for the current instrument.
Returns: Pip size adjusted for Forex instruments or 1 for others.
f_table_get_position(value)
Maps a string to a table position constant.
Parameters:
value (string) : String representing the desired position (e.g., "Top Right").
Returns: The corresponding position constant or `na` for invalid values.

Breaks and Retests - Free990Strategy Description: "Breaks and Retests - Free990"
The "Breaks and Retests - Free990" strategy is based on identifying breakout and retest opportunities for potential entries in both long and short trades. The idea is to detect price breakouts above resistance levels or below support levels, and subsequently identify retests that confirm the breakout levels. The strategy offers an automated approach to enter trades after a breakout followed by a retest, which serves as a confirmation of trend continuation.
Key Components:
Support and Resistance Detection:
The strategy calculates pivot levels based on historical price movements to define support and resistance areas. A lookback range is used to determine these key levels.
Breakouts and Retests:
The system identifies when a breakout occurs above a resistance level or below a support level.
It then waits for a retest of the previously broken level as confirmation, which is often a better entry opportunity.
Trade Direction Selection:
Users can choose between "Long Only," "Short Only," or "Both" directions for trading based on their market view.
Stop Loss and Trailing Stop:
An initial stop loss is placed at a defined percentage away from the entry.
The trailing stop loss is activated after the position gains a specified percentage in profit.
Long Entry:
A long entry is triggered if the price breaks above a resistance level and subsequently retests that level successfully.
The entry condition checks if the breakout was confirmed and if a retest was valid.
The long entry is only executed if the user-selected direction is either "Long Only" or "Both."
Short Entry:
A short entry is triggered if the price breaks below a support level and subsequently retests that level.
The short entry is only executed if the user-selected direction is either "Short Only" or "Both."
sell_condition checks whether the support has been broken and whether the retest condition is valid.
An initial stop loss is placed when the trade is opened to limit the risk if the trade moves against the position.
The stop loss is calculated based on a user-defined percentage (stop_loss_percent) of the entry price.
pinescript
Copy code
stop_loss_price := strategy.position_avg_price * (1 - stop_loss_percent / 100)
For long positions, the stop loss is placed below the entry price.
For short positions, the stop loss is placed above the entry price.
Trailing Stop:
When a position achieves a certain profit threshold (profit_threshold_percent), the trailing stop mechanism is activated.
For long positions, the trailing stop follows the highest price reached, ensuring that some profit is locked in if the price reverses.
For short positions, the trailing stop follows the lowest price reached.
Code Logic for Trailing Stop:
Exit Execution:
The strategy exits the position when the price hits the calculated stop loss level.
This includes both the initial stop loss and the trailing stop that adjusts as the trade progresses.
Code Logic for Exit:
Summary:
Breaks and Retests - Free990 uses support and resistance levels to identify breakouts, followed by retests for confirmation.
Entry Points: Triggered when a breakout is confirmed and a retest occurs, for both long and short trades.
Exit Points:
Initial Stop Loss: Limits risk for both long and short trades.
Trailing Stop Loss: Locks in profits as the price moves in favor of the position.
This strategy aims to capture the momentum after breakouts and minimize losses through effective use of stop loss and trailing stops. It gives the flexibility of selecting trade direction and ensures trades are taken with confirmation through the retest, which helps to reduce false breakouts.
Original Code by @HoanGhetti

Fibonacci Levels Strategy with High/Low Criteria-AYNETThis code represents a TradingView strategy that uses Fibonacci levels in conjunction with high/low price criteria over specified lookback periods to determine buy (long) and sell (short) conditions. Below is an explanation of each main part of the code:
Explanation of Key Sections
User Inputs for Higher Time Frame and Candle Settings
Users can select a higher time frame (timeframe) for analysis and specify whether to use the "Current" or "Last" higher time frame (HTF) candle for calculating Fibonacci levels.
The currentlast setting allows flexibility between using real-time or the most recent closed higher time frame candle.
Lookback Periods for High/Low Criteria
Two lookback periods, lowestLookback and highestLookback, allow users to set the number of bars to consider when finding the lowest and highest prices, respectively.
This determines the criteria for entering trades based on how recent highs or lows compare to current prices.
Fibonacci Levels Configuration
Fibonacci levels (0%, 23.6%, 38.2%, 50%, 61.8%, 78.6%, and 100%) are configurable. These are used to calculate price levels between the high and low of the higher time frame candle.
Each level represents a retracement or extension relative to the high/low range of the HTF candle, providing important price levels for decision-making.
HTF Candle Calculation
HTF candle data is calculated based on the higher time frame selected by the user, using the newbar check to reset htfhigh, htflow, and htfopen values.
The values are updated with each new HTF bar or as prices move within the same HTF bar to track the highest high and lowest low accurately.
Set Fibonacci Levels Array
Using the calculated HTF candle's high, low, and open, the Fibonacci levels are computed by interpolating these values according to the user-defined Fibonacci levels.
A fibLevels array stores these computed values.
Plotting Fibonacci Levels
Each Fibonacci level is plotted on the chart with a different color, providing visual indicators for potential support/resistance levels.
High/Low Price Criteria Calculation
The lowest and highest prices over the specified lookback periods (lowestLookback and highestLookback) are calculated and plotted on the chart. These serve as dynamic levels to trigger long or short entries.
Trade Signal Conditions
longCondition: A long (buy) signal is generated when the price crosses above both the lowest price criteria and the 50% Fibonacci level.
shortCondition: A short (sell) signal is generated when the price crosses below both the highest price criteria and the 50% Fibonacci level.
Executing Trades
Based on the longCondition and shortCondition, trades are entered with the strategy.entry() function, using the labels "Long" and "Short" for tracking on the chart.
Strategy Use
This strategy allows traders to utilize Fibonacci retracement levels and recent highs/lows to identify trend continuation or reversal points, potentially providing entry points aligned with larger market structure. Adjusting the lowestLookback and highestLookback along with Fibonacci levels enables a customizable approach to suit different trading styles and market conditions.

PTS - Bollinger Bands with Trailing StopPTS - Bollinger Bands with Trailing Stop Strategy
Overview
The "PTS - Bollinger Bands with Trailing Stop" strategy is designed to capitalize on strong bullish market movements by combining the Bollinger Bands indicator with a dynamic trailing stop based on the Average True Range (ATR). This strategy aims to enter long positions during upward breakouts and protect profits through an adaptive exit mechanism.
Key Features
1. Bollinger Bands Indicator
Basis Moving Average Type: Choose from SMA, EMA, SMMA, WMA, or VWMA for the Bollinger Bands' basis line. Length: Adjustable period for calculating the moving average and standard deviation (default is 20). Standard Deviation Multiplier (StdDev): Determines the width of the bands (default is 2.0). Source: Select the price data used for calculations (default is the closing price).
2. Entry Conditions
The strategy enters a long position when the closing price crosses above the upper Bollinger Band , indicating strong upward momentum.
3. Exit Conditions
Trailing Stop Loss: Implemented using ATR to adjust dynamically with market volatility. ATR Length: Period for calculating ATR (default is 14). ATR Multiplier for Trailing Stop: Determines how closely the trailing stop follows the price (default is 2.0). Close Below Lower Bollinger Band: The strategy exits the long position if the closing price crosses below the lower Bollinger Band .
4. Risk Management
Commission and Slippage: Commission is set at 0.1%; slippage is set to 3. Position Sizing: Uses 100% of equity per trade (adjustable).
5. Date Range Filter
Specify the time period during which the strategy is active. Start Date: January 1, 2018. End Date: December 31, 2069.
Customizable Inputs
BB Length: Adjust the period for Bollinger Bands calculation. BB StdDev: Modify the standard deviation multiplier. Basis MA Type: Select the moving average type. Source: Choose the price data source. Offset: Shift the Bollinger Bands on the chart. ATR Length: Set the period for ATR calculation. ATR Multiplier for Trailing Stop: Adjust the trailing stop sensitivity.
Thought for 1m 7s
Description for the "PTS - Bollinger Bands with Trailing Stop" Strategy
PTS - Bollinger Bands with Trailing Stop Strategy
Overview
The "PTS - Bollinger Bands with Trailing Stop" strategy is designed to capitalize on strong bullish market movements by combining the Bollinger Bands indicator with a dynamic trailing stop based on the Average True Range (ATR). This strategy aims to enter long positions during upward breakouts and protect profits through an adaptive exit mechanism.
Key Features
1. Bollinger Bands Indicator
Basis Moving Average Type: Choose from SMA, EMA, SMMA, WMA, or VWMA for the Bollinger Bands' basis line. Length: Adjustable period for calculating the moving average and standard deviation (default is 20). Standard Deviation Multiplier (StdDev): Determines the width of the bands (default is 2.0). Source: Select the price data used for calculations (default is the closing price).
2. Entry Conditions
The strategy enters a long position when the closing price crosses above the upper Bollinger Band , indicating strong upward momentum.
3. Exit Conditions
Trailing Stop Loss: Implemented using ATR to adjust dynamically with market volatility. ATR Length: Period for calculating ATR (default is 14). ATR Multiplier for Trailing Stop: Determines how closely the trailing stop follows the price (default is 2.0). Close Below Lower Bollinger Band: The strategy exits the long position if the closing price crosses below the lower Bollinger Band .
4. Risk Management
Commission and Slippage: Commission is set at 0.1%; slippage is set to 3. Position Sizing: Uses 100% of equity per trade (adjustable).
5. Date Range Filter
Specify the time period during which the strategy is active. Start Date: January 1, 2018. End Date: December 31, 2069.
Customizable Inputs
BB Length: Adjust the period for Bollinger Bands calculation. BB StdDev: Modify the standard deviation multiplier. Basis MA Type: Select the moving average type. Source: Choose the price data source. Offset: Shift the Bollinger Bands on the chart. ATR Length: Set the period for ATR calculation. ATR Multiplier for Trailing Stop: Adjust the trailing stop sensitivity.
How the Strategy Works
1. Initialization
Calculates Bollinger Bands and ATR based on selected parameters.
2. Entry Logic
Opens a long position when the closing price exceeds the upper Bollinger Band.
3. Exit Logic
Uses a trailing stop loss based on ATR. Exits if the closing price drops below the lower Bollinger Band.
4. Date Filtering
Executes trades only within the specified date range.
Advantages
Adaptive Risk Management: Trailing stop adjusts to market volatility. Simplicity: Clear entry and exit signals. Customizable Parameters: Tailor the strategy to different assets or conditions.
Considerations
Aggressive Position Sizing: Using 100% equity per trade is high-risk. Market Conditions: Best in trending markets; may produce false signals in sideways markets. Backtesting: Always test on historical data before live trading.
Disclaimer
This strategy is intended for educational and informational purposes only. Trading involves significant risk, and past performance is not indicative of future results. Assess your financial situation and consult a financial advisor if necessary.
Usage Instructions
1. Apply the Strategy: Add it to your TradingView chart. 2. Configure Inputs: Adjust parameters to suit your style and asset. 3. Analyze Backtest Results: Use the Strategy Tester. 4. Optimize Parameters: Experiment with input values. 5. Risk Management: Evaluate position sizing and incorporate risk controls.
Final Notes
The "PTS - Bollinger Bands with Trailing Stop" strategy provides a framework to leverage momentum breakouts while managing risk through adaptive trailing stops. Customize and test thoroughly to align with your trading objectives.

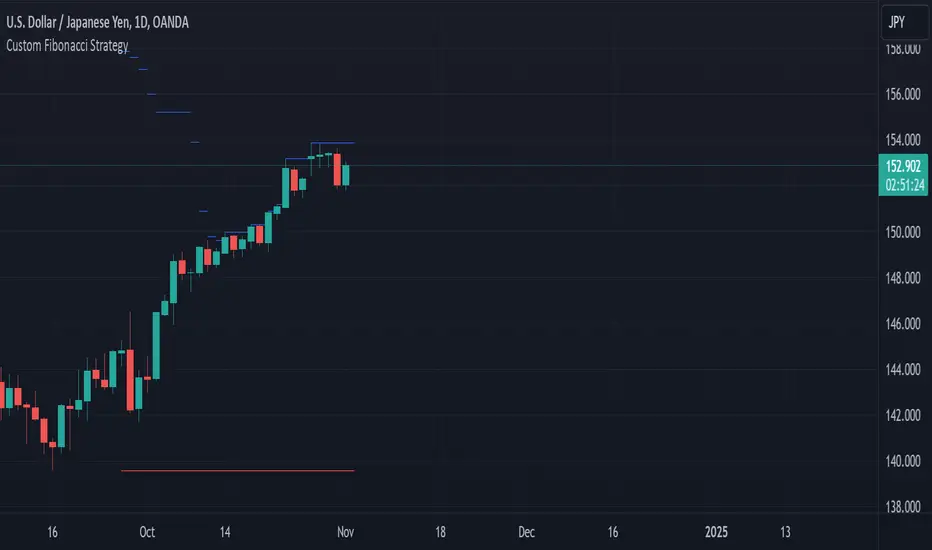
Custom Fibonacci StrategyCustom Fibonacci Strategy:
This strategy relies on analyzing Fibonacci levels to identify entry points for trades. It works by identifying peaks and troughs over a specified time period (50 bars in this code). Here are the steps of the strategy:
Identifying Peaks and Troughs:
The highest peak and lowest trough over the last 50 bars are identified.
If the price exceeds the previous peak, it is considered a break of the peak.
If the price falls below the previous trough after breaking the peak, it is considered a break of the trough.
Calculating Fibonacci Levels:
The 50% level (midway point) between the identified peak and trough is calculated.
Buy Signals:
When a trough is broken, and the price trades at or below the 50% level, the risk-to-reward ratio is evaluated.
If the risk-to-reward ratio is greater than or equal to 2, a buy signal is generated.
Displaying Levels:
Horizontal lines are displayed on the chart to illustrate the peak, trough, and Fibonacci level.
Summary
This strategy provides a systematic approach to trading based on Fibonacci retracement levels and price action, allowing traders to make informed decisions about entry points and manage risk effectively.
XAUUSD 10-Minute StrategyThis XAUUSD 10-Minute Strategy is designed for trading Gold vs. USD on a 10-minute timeframe. By combining multiple technical indicators (MACD, RSI, Bollinger Bands, and ATR), the strategy effectively captures both trend-following and reversal opportunities, with adaptive risk management for varying market volatility. This approach balances high-probability entries with robust volatility management, making it suitable for traders seeking to optimise entries during significant price movements and reversals.
Key Components and Logic:
MACD (12, 26, 9):
Generates buy signals on MACD Line crossovers above the Signal Line and sell signals on crossovers below the Signal Line, helping to capture momentum shifts.
RSI (14):
Utilizes oversold (below 35) and overbought (above 65) levels as a secondary filter to validate entries and avoid overextended price zones.
Bollinger Bands (20, 2):
Uses upper and lower Bollinger Bands to identify potential overbought and oversold conditions, aiming to enter long trades near the lower band and short trades near the upper band.
ATR-Based Stop Loss and Take Profit:
Stop Loss and Take Profit levels are dynamically set as multiples of ATR (3x for stop loss, 5x for take profit), ensuring flexibility with market volatility to optimise exit points.
Entry & Exit Conditions:
Buy Entry: T riggered when any of the following conditions are met:
MACD Line crosses above the Signal Line
RSI is oversold
Price drops below the lower Bollinger Band
Sell Entry: Triggered when any of the following conditions are met:
MACD Line crosses below the Signal Line
RSI is overbought
Price moves above the upper Bollinger Band
Exit Strategy: Trades are closed based on opposing entry signals, with adaptive spread adjustments for realistic exit points.
Backtesting Configuration & Results:
Backtesting Period: July 21, 2024, to October 30, 2024
Symbol Info: XAUUSD, 10-minute timeframe, OANDA data source
Backtesting Capital: Initial capital of $700, with each trade set to 10 contracts (equivalent to approximately 0.1 lots based on the broker’s contract size for gold).
Users should confirm their broker's contract size for gold, as this may differ. This script uses 10 contracts for backtesting purposes, aligned with 0.1 lots on brokers offering a 100-contract specification.
Key Backtesting Performance Metrics:
Net Profit: $4,733.90 USD (676.27% increase)
Total Closed Trades: 526
Win Rate: 53.99%
Profit Factor: 1.44 (1.96 for Long trades, 1.14 for Short trades)
Max Drawdown: $819.75 USD (56.33% of equity)
Sharpe Ratio: 1.726
Average Trade: $9.00 USD (0.04% of equity per trade)
This backtest reflects realistic conditions, with a spread adjustment of 38 points and no slippage or commission applied. The settings aim to simulate typical retail trading conditions. However, please adjust the initial capital, contract size, and other settings based on your account specifics for best results.
Usage:
This strategy is tuned specifically for XAUUSD on a 10-minute timeframe, ideal for both trend-following and reversal trades. The ATR-based stop loss and take profit levels adapt dynamically to market volatility, optimising entries and exits in varied conditions. To backtest this script accurately, ensure your broker’s contract specifications for gold align with the parameters used in this strategy.

DSL Strategy [DailyPanda]
Overview
The DSL Strategy by DailyPanda is a trading strategy that synergistically combines the idea from indicators to create a more robust and reliable trading tool. By integrating these indicators, the strategy enhances signal accuracy and provides traders with a comprehensive view of market trends and momentum shifts. This combination allows for better entry and exit points, improved risk management, and adaptability to various market conditions.
Combining ideas from indicators adds value by:
Enhancing Signal Confirmation : The strategy requires alignment between trend and momentum before generating trade signals, reducing false entries.
Improving Accuracy : By integrating price action with momentum analysis, the strategy captures more reliable trading opportunities.
Providing Comprehensive Market Insight : The combination offers a better perspective on the market, considering both the direction (trend) and the strength (momentum) of price movements.
How the Components Work Together
1. Trend Identification with DSL Indicator
Dynamic Signal Lines : Calculates upper and lower DSL lines based on a moving average (SMA) and dynamic thresholds derived from recent highs and lows with a specified offset. These lines adapt to market conditions, providing real-time trend insights.
ATR-Based Bands : Adds bands around the DSL lines using the Average True Range (ATR) multiplied by a width factor. These bands account for market volatility and help identify potential stop-loss levels.
Trend Confirmation : The relationship between the price, DSL lines, and bands determines the current trend. For example, if the price consistently stays above the upper DSL line, it indicates a bullish trend.
2. Momentum Analysis
RSI Calculation : Computes the RSI over a specified period to measure the speed and change of price movements.
Zero-Lag EMA (ZLEMA) : Applies a ZLEMA to the RSI to minimize lag and produce a more responsive oscillator.
DSL Application on Oscillator : Implements the DSL concept on the oscillator by calculating dynamic upper and lower levels. This helps identify overbought or oversold conditions more accurately.
Signal Generation : Detects crossovers between the oscillator and its DSL lines. A crossover above the lower DSL line signals potential bullish momentum, while a crossover below the upper DSL line signals potential bearish momentum.
3. Integrated Signal Filtering
Confluence Requirement : A trade signal is generated only when both the DSL indicator and oscillator agree. For instance, a long entry requires both an uptrend confirmation from the DSL indicator and a bullish momentum signal from the oscillator.
Risk Management Integration : The strategy uses the DSL indicator's bands for setting stop-loss levels and calculates take-profit levels based on a user-defined risk-reward ratio. This ensures that every trade has a predefined risk management plan.
--------------------------------------------------------------------------------------------
Originality and Value Added to the Community
Unique Synergy : While both indicators are available individually, this strategy is original in how it combines them to enhance their strengths and mitigate their weaknesses, offering a novel approach not present in existing scripts.
Enhanced Reliability : By requiring confirmation from both trend and momentum indicators, the strategy reduces false signals and increases the likelihood of successful trades.
Versatility : The customizable parameters allow traders to adapt the strategy to different instruments, timeframes, and trading styles, making it a valuable tool for a wide range of trading scenarios.
Educational Contribution : The script demonstrates an effective method of combining indicators for improved trading performance, providing insights that other traders can learn from and apply to their own strategies.
--------------------------------------------------------------------------------------------
How to Use the Strategy
Adding the Strategy to Your Chart
Apply the DSL Strategy to your desired trading instrument and timeframe on TradingView.
--------------------------------------------------------------------------------------------
Configuring Parameters
DSL Indicator Settings :
Length (len) : Adjusts the sensitivity of the DSL lines (default is 34).
Offset : Determines the look-back period for threshold calculations (default is 30).
Bands Width (width) : Changes the distance of the ATR-based bands from the DSL lines (default is 1).
DSL-BELUGA Oscillator Settings :
Beluga Length (len_beluga) : Sets the period for the RSI calculation in the oscillator (default is 10).
DSL Lines Mode (dsl_mode) : Chooses between "Fast" (more responsive) and "Slow" (smoother) modes for the oscillator's DSL lines.
Risk Management :
Risk Reward (risk_reward) : Defines your desired risk-reward ratio for calculating take-profit levels (default is 1.5).
--------------------------------------------------------------------------------------------
Interpreting Signals
Long Entry Conditions :
Trend Confirmation : Price is above the upper DSL line and the upper DSL band (dsl_up1 > dsl_dn).
Price Behavior : The last three candles have both their opens and closes above the upper DSL line.
Momentum Signal : The DSL-BELUGA oscillator crosses above its lower DSL line (up_signal), indicating bullish momentum.
Short Entry Conditions :
Trend Confirmation : Price is below the lower DSL line and the lower DSL band (dsl_dn < dsl_up1).
Price Behavior : The last three candles have both their opens and closes below the lower DSL band.
Momentum Signal : The DSL-BELUGA oscillator crosses below its upper DSL line (dn_signal), indicating bearish momentum.
Exit Conditions :
Stop-Loss : Automatically set at the DSL indicator's band level (upper band for longs, lower band for shorts).
Take-Profit : Calculated based on the risk-reward ratio and the initial risk determined by the stop-loss distance.
Visual Aids
Signal Arrows : Upward green arrows for long entries and downward blue arrows for short entries appear on the chart when conditions are met.
Stop-Loss and Take-Profit Lines : Red and green lines display the calculated stop-loss and take-profit levels for active trades.
Background Highlighting : The chart background subtly changes color to indicate when a signal has been generated.
Backtesting and Optimization
Use TradingView's strategy tester to backtest the strategy over historical data.
Adjust parameters to optimize performance for different instruments or market conditions.
Regularly review backtesting results to ensure the strategy remains effective.

Up/Down Volume with Normal DistributionThis indicator analyzes the relationship between price movements and trading volume by distinguishing between "up" and "down" volume. Up volume refers to trading volume occurring during price increases, while down volume refers to trading volume during price decreases. The indicator calculates the mean and standard deviation for both up and down volume over a specified length. This statistical approach enables traders to visualize volume deviations from the average, highlighting potential market anomalies that could signal trading opportunities.
Relationship Between Price and Volume
Volume is a critical metric in technical analysis, often considered a leading indicator of price movements. According to studies in financial economics, significant price changes accompanied by high volume tend to indicate strong market conviction (Wyart et al., 2008). Conversely, price changes on low volume may suggest a lack of interest or conviction, making those moves less reliable.
The relationship between price and volume can be summarized as follows:
Confirmation of Trends: High volume accompanying a price increase often confirms an upward trend. Similarly, high volume during price declines indicates bearish sentiment.
Reversals and Exhaustion: Decreases in volume during price increases may suggest a potential reversal or exhaustion of buying pressure, while increased volume during declines can indicate capitulation.
Breakouts: Price movements that break through significant resistance or support levels accompanied by high volume are typically more significant and suggest stronger follow-through in the new direction.
Developing a Trading Strategy
Traders can leverage the insights gained from this relationship to formulate a trading strategy based on volume analysis:
Entry Signals: Traders can enter long positions when the up volume significantly exceeds the mean by a predefined number of standard deviations. This situation indicates strong buying interest. Conversely, short positions can be initiated when down volume exceeds the mean by a specified standard deviation.
Exit Signals: Exiting positions can be based on changes in volume patterns. If the volume starts to decrease significantly after a price increase, this may signal a potential reversal or the need to lock in profits.
Risk Management: Integrating volume analysis with other technical indicators, such as moving averages or RSI, can provide a more comprehensive risk management framework, enhancing the overall effectiveness of the strategy.
In conclusion, understanding the relationship between price and volume, alongside employing statistical measures like the mean and standard deviation, enables traders to create more robust trading strategies that capitalize on market movements.
References
Wyart, M., Bouchaud, J.-P., & Dacorogna, M. (2008). "Self-organized volatility in a complicated market." European Physical Journal B, 61(2), 195-203. doi:10.1140

ICT Master Suite [Trading IQ]Hello Traders!
We’re excited to introduce the ICT Master Suite by TradingIQ, a new tool designed to bring together several ICT concepts and strategies in one place.
The Purpose Behind the ICT Master Suite
There are a few challenges traders often face when using ICT-related indicators:
Many available indicators focus on one or two ICT methods, which can limit traders who apply a broader range of ICT related techniques on their charts.
There aren't many indicators for ICT strategy models, and we couldn't find ICT indicators that allow for testing the strategy models and setting alerts.
Many ICT related concepts exist in the public domain as indicators, not strategies! This makes it difficult to verify that the ICT concept has some utility in the market you're trading and if it's worth trading - it's difficult to know if it's working!
Some users might not have enough chart space to apply numerous ICT related indicators, which can be restrictive for those wanting to use multiple ICT techniques simultaneously.
The ICT Master Suite is designed to offer a comprehensive option for traders who want to apply a variety of ICT methods. By combining several ICT techniques and strategy models into one indicator, it helps users maximize their chart space while accessing multiple tools in a single slot.
Additionally, the ICT Master Suite was developed as a strategy . This means users can backtest various ICT strategy models - including deep backtesting. A primary goal of this indicator is to let traders decide for themselves what markets to trade ICT concepts in and give them the capability to figure out if the strategy models are worth trading!
What Makes the ICT Master Suite Different
There are many ICT-related indicators available on TradingView, each offering valuable insights. What the ICT Master Suite aims to do is bring together a wider selection of these techniques into one tool. This includes both key ICT methods and strategy models, allowing traders to test and activate strategies all within one indicator.
Features
The ICT Master Suite offers:
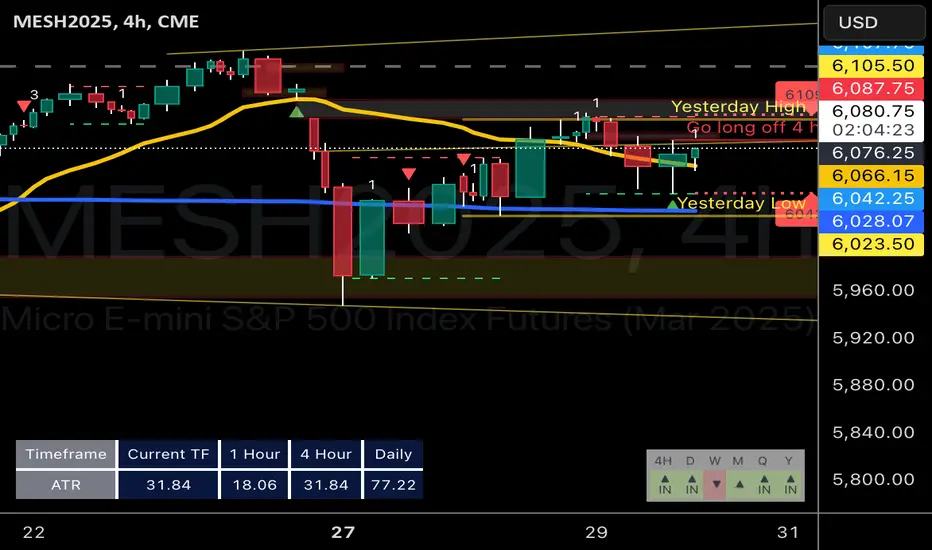
Multiple ICT strategy models, including the 2022 Strategy Model and Unicorn Model, which can be built, tested, and used for live trading.
Calculation and display of key price areas like Breaker Blocks, Rejection Blocks, Order Blocks, Fair Value Gaps, Equal Levels, and more.
The ability to set alerts based on these ICT strategies and key price areas.
A comprehensive, yet practical, all-inclusive ICT indicator for traders.
Customizable Timeframe - Calculate ICT concepts on off-chart timeframes
Unicorn Strategy Model
2022 Strategy Model
Liquidity Raid Strategy Model
OTE (Optimal Trade Entry) Strategy Model
Silver Bullet Strategy Model
Order blocks
Breaker blocks
Rejection blocks
FVG
Strong highs and lows
Displacements
Liquidity sweeps
Power of 3
ICT Macros
HTF previous bar high and low
Break of Structure indications
Market Structure Shift indications
Equal highs and lows
Swings highs and swing lows
Fibonacci TPs and SLs
Swing level TPs and SLs
Previous day high and low TPs and SLs
And much more! An ongoing project!
How To Use
Many traders will already be familiar with the ICT related concepts listed above, and will find using the ICT Master Suite quite intuitive!
Despite this, let's go over the features of the tool in-depth and how to use the tool!
The image above shows the ICT Master Suite with almost all techniques activated.
ICT 2022 Strategy Model
The ICT Master suite provides the ability to test, set alerts for, and live trade the ICT 2022 Strategy Model.
The image above shows an example of a long position being entered following a complete setup for the 2022 ICT model.
A liquidity sweep occurs prior to an upside breakout. During the upside breakout the model looks for the FVG that is nearest 50% of the setup range. A limit order is placed at this FVG for entry.
The target entry percentage for the range is customizable in the settings. For instance, you can select to enter at an FVG nearest 33% of the range, 20%, 66%, etc.
The profit target for the model generally uses the highest high of the range (100%) for longs and the lowest low of the range (100%) for shorts. Stop losses are generally set at 0% of the range.
The image above shows the short model in action!
Whether you decide to follow the 2022 model diligently or not, you can still set alerts when the entry condition is met.
ICT Unicorn Model
The image above shows an example of a long position being entered following a complete setup for the ICT Unicorn model.
A lower swing low followed by a higher swing high precedes the overlap of an FVG and breaker block formed during the sequence.
During the upside breakout the model looks for an FVG and breaker block that formed during the sequence and overlap each other. A limit order is placed at the nearest overlap point to current price.
The profit target for this example trade is set at the swing high and the stop loss at the swing low. However, both the profit target and stop loss for this model are configurable in the settings.
For Longs, the selectable profit targets are:
Swing High
Fib -0.5
Fib -1
Fib -2
For Longs, the selectable stop losses are:
Swing Low
Bottom of FVG or breaker block
The image above shows the short version of the Unicorn Model in action!
For Shorts, the selectable profit targets are:
Swing Low
Fib -0.5
Fib -1
Fib -2
For Shorts, the selectable stop losses are:
Swing High
Top of FVG or breaker block
The image above shows the profit target and stop loss options in the settings for the Unicorn Model.
Optimal Trade Entry (OTE) Model
The image above shows an example of a long position being entered following a complete setup for the OTE model.
Price retraces either 0.62, 0.705, or 0.79 of an upside move and a trade is entered.
The profit target for this example trade is set at the -0.5 fib level. This is also adjustable in the settings.
For Longs, the selectable profit targets are:
Swing High
Fib -0.5
Fib -1
Fib -2
The image above shows the short version of the OTE Model in action!
For Shorts, the selectable profit targets are:
Swing Low
Fib -0.5
Fib -1
Fib -2
Liquidity Raid Model
The image above shows an example of a long position being entered following a complete setup for the Liquidity Raid Modell.
The user must define the session in the settings (for this example it is 13:30-16:00 NY time).
During the session, the indicator will calculate the session high and session low. Following a “raid” of either the session high or session low (after the session has completed) the script will look for an entry at a recently formed breaker block.
If the session high is raided the script will look for short entries at a bearish breaker block. If the session low is raided the script will look for long entries at a bullish breaker block.
For Longs, the profit target options are:
Swing high
User inputted Lib level
For Longs, the stop loss options are:
Swing low
User inputted Lib level
Breaker block bottom
The image above shows the short version of the Liquidity Raid Model in action!
For Shorts, the profit target options are:
Swing Low
User inputted Lib level
For Shorts, the stop loss options are:
Swing High
User inputted Lib level
Breaker block top
Silver Bullet Model
The image above shows an example of a long position being entered following a complete setup for the Silver Bullet Modell.
During the session, the indicator will determine the higher timeframe bias. If the higher timeframe bias is bullish the strategy will look to enter long at an FVG that forms during the session. If the higher timeframe bias is bearish the indicator will look to enter short at an FVG that forms during the session.
For Longs, the profit target options are:
Nearest Swing High Above Entry
Previous Day High
For Longs, the stop loss options are:
Nearest Swing Low
Previous Day Low
The image above shows the short version of the Silver Bullet Model in action!
For Shorts, the profit target options are:
Nearest Swing Low Below Entry
Previous Day Low
For Shorts, the stop loss options are:
Nearest Swing High
Previous Day High
Order blocks
The image above shows indicator identifying and labeling order blocks.
The color of the order blocks, and how many should be shown, are configurable in the settings!
Breaker Blocks
The image above shows indicator identifying and labeling order blocks.
The color of the breaker blocks, and how many should be shown, are configurable in the settings!
Rejection Blocks
The image above shows indicator identifying and labeling rejection blocks.
The color of the rejection blocks, and how many should be shown, are configurable in the settings!
Fair Value Gaps
The image above shows indicator identifying and labeling fair value gaps.
The color of the fair value gaps, and how many should be shown, are configurable in the settings!
Additionally, you can select to only show fair values gaps that form after a liquidity sweep. Doing so reduces "noisy" FVGs and focuses on identifying FVGs that form after a significant trading event.
The image above shows the feature enabled. A fair value gap that occurred after a liquidity sweep is shown.
Market Structure
The image above shows the ICT Master Suite calculating market structure shots and break of structures!
The color of MSS and BoS, and whether they should be displayed, are configurable in the settings.
Displacements
The images above show indicator identifying and labeling displacements.
The color of the displacements, and how many should be shown, are configurable in the settings!
Equal Price Points
The image above shows the indicator identifying and labeling equal highs and equal lows.
The color of the equal levels, and how many should be shown, are configurable in the settings!
Previous Custom TF High/Low
The image above shows the ICT Master Suite calculating the high and low price for a user-defined timeframe. In this case the previous day’s high and low are calculated.
To illustrate the customizable timeframe function, the image above shows the indicator calculating the previous 4 hour high and low.
Liquidity Sweeps
The image above shows the indicator identifying a liquidity sweep prior to an upside breakout.
The image above shows the indicator identifying a liquidity sweep prior to a downside breakout.
The color and aggressiveness of liquidity sweep identification are adjustable in the settings!
Power Of Three
The image above shows the indicator calculating Po3 for two user-defined higher timeframes!
Macros
The image above shows the ICT Master Suite identifying the ICT macros!
ICT Macros are only displayable on the 5 minute timeframe or less.
Strategy Performance Table
In addition to a full-fledged TradingView backtest for any of the ICT strategy models the indicator offers, a quick-and-easy strategy table exists for the indicator!
The image above shows the strategy performance table in action.
Keep in mind that, because the ICT Master Suite is a strategy script, you can perform fully automatic backtests, deep backtests, easily add commission and portfolio balance and look at pertinent metrics for the ICT strategies you are testing!
Lite Mode
Traders who want the cleanest chart possible can toggle on “Lite Mode”!
In Lite Mode, any neon or “glow” like effects are removed and key levels are marked as strict border boxes. You can also select to remove box borders if that’s what you prefer!
Settings Used For Backtest
For the displayed backtest, a starting balance of $1000 USD was used. A commission of 0.02%, slippage of 2 ticks, a verify price for limit orders of 2 ticks, and 5% of capital investment per order.
A commission of 0.02% was used due to the backtested asset being a perpetual future contract for a crypto currency. The highest commission (lowest-tier VIP) for maker orders on many exchanges is 0.02%. All entered positions take place as maker orders and so do profit target exits. Stop orders exist as stop-market orders.
A slippage of 2 ticks was used to simulate more realistic stop-market orders. A verify limit order settings of 2 ticks was also used. Even though BTCUSDT.P on Binance is liquid, we just want the backtest to be on the safe side. Additionally, the backtest traded 100+ trades over the period. The higher the sample size the better; however, this example test can serve as a starting point for traders interested in ICT concepts.
Community Assistance And Feedback
Given the complexity and idiosyncratic applications of ICT concepts amongst its proponents, the ICT Master Suite’s built-in strategies and level identification methods might not align with everyone's interpretation.
That said, the best we can do is precisely define ICT strategy rules and concepts to a repeatable process, test, and apply them! Whether or not an ICT strategy is trading precisely how you would trade it, seeing the model in action, taking trades, and with performance statistics is immensely helpful in assessing predictive utility.
If you think we missed something, you notice a bug, have an idea for strategy model improvement, please let us know! The ICT Master Suite is an ongoing project that will, ideally, be shaped by the community.
A big thank you to the @PineCoders for their Time Library!
Thank you!

ICT Panther (By Obicrypto) V1 ICT Panther Indicator: Full and Detailed Description
The ICT Panther Indicator, created by Obicrypto, is an advanced technical analysis tool designed specifically for traders looking to identify key price action events based on institutional trading techniques, particularly in the context of the Inner Circle Trader (ICT) methodology. This indicator helps traders spot market structure breaks, order blocks, and potential trade opportunities driven by institutional behaviors in the market. Here's a detailed breakdown of its features and how it works:
What Does the ICT Panther Indicator Do?
1. Market Structure Breaks (MSB) Identification:
The ICT Panther identifies critical points where the market changes direction, commonly referred to as a break of structure (BoS). When the price breaks above or below certain key levels (based on highs and lows or opens and closes), it signals a potential shift in market sentiment. These break-of-structure points are essential for traders to determine whether the market is likely to continue its trend or reverse.
2. Order Blocks Visualization:
The indicator plots demand (bullish) and supply (bearish) boxes, which represent areas where institutional traders might place significant buy or sell orders. These zones, known as order blocks, are areas where the price tends to pause or reverse, giving traders key insights into potential entry and exit points. The indicator shows these areas graphically as colored boxes on the chart, which can be used to plan trades based on market structure and price action.
3. Pivot Point Detection:
The ICT Panther identifies important pivot points by tracking higher highs and lower lows. These pivot points are critical in determining the strength of a trend and can help traders confirm the direction of the market. The indicator uses a unique algorithm to detect two levels of pivot points:
- First-Order Pivots: Major pivot points where the price makes notable highs and lows.
- Second-Order Pivots: Smaller pivot points, useful for detecting microtrends within the larger market structure.
4. Bullish and Bearish Break of Structure Lines:
When a significant market structure break (BoS) occurs, the indicator will automatically draw red lines (for bearish break of structure) and green lines (for bullish break of structure) at key price levels. These lines help traders quickly see where institutional moves have occurred in the past and where potential future price moves could originate from.
5. Tested and Filled Boxes:
The ICT Panther also has a built-in mechanism to dim previously tested order blocks. When the price tests an order block (returns to a previous demand or supply zone), the box's color dims to indicate that the area has already been tested, reducing its significance. If the price fully fills an order block, the box stops plotting, providing a clear and clutter-free chart.
Key Features
1. Market Structure Break (MSB) Trigger:
- The indicator allows users to select between highs/lows or opens/closes as the trigger for market structure breaks. This flexibility lets traders adjust the indicator to suit their personal trading style or the behavior of specific assets.
2. Order Block Detection and Visualization:
- The tool automatically plots bullish and bearish demand and supply boxes, representing institutional order blocks on the chart. These boxes provide visual cues for areas of potential price action, where institutional traders might be active.
3. Second-Order Pivot Highlighting:
- The ICT Panther offers an option to plot second-order pivots, highlighting smaller pivot points within the larger market structure. These pivots can be helpful for short-term traders who need to react to smaller price movements while still keeping the larger trend in mind.
4. Box Test and Fill Delays:
- Users can configure delays for box tests and box fills, meaning the indicator will only mark a box as tested or filled after a certain number of bars. This prevents false signals and helps confirm that a zone is truly significant in the market.
5. Customization and Visual Clarity:
- The indicator is highly customizable, allowing users to turn on or off various features like:
- Displaying second-order pivots.
- Highlighting candles that broke structure.
- Plotting market structure broke lines.
- Showing or hiding tested and filled demand boxes.
- Setting custom delays for box testing and filling to suit different market conditions.
6. Tested and Filled Order Block Visualization:
- The indicator visually adjusts the tested and filled order blocks, dimming tested zones and removing filled zones to avoid clutter on the chart. This ensures that traders can focus on active trading opportunities without distractions from historical data.
How Does It Work?
1. Detecting Market Structure Breaks (BoS):
- The indicator continuously tracks the market for key price action signals. When the price breaks through previous highs or lows (or opens and closes, depending on your selection), the indicator marks this as a break of structure. This is a critical signal used by institutional traders and retail traders alike to determine potential future price movements.
2. Order Block Identification:
- Whenever a bullish break of structure occurs, the indicator plots a green demand box to show the area where institutional buyers might have placed significant orders. Similarly, for a bearish break of structure, it plots a red supply box representing areas where institutional sellers are active.
3. Pivot Analysis and Tracking:
- As the market moves, the indicator continuously updates first-order and second-order pivot points based on highs and lows. These points help traders identify whether the market is trending or consolidating. Traders can use these pivot points in combination with the order blocks to make informed trading decisions.
4. Box Testing and Filling:
- When the price retests an existing order block, the box dims to show it has been tested. If the price fully fills the box, it is no longer shown, which helps traders focus on the most relevant, untested order blocks.
Benefits for Traders
- Improved Decision-Making: With clear visuals and advanced logic based on institutional trading strategies, this indicator provides a deeper understanding of market structure and price action.
- Reduced Clutter: The indicator intelligently manages the display of order blocks and pivot points, ensuring that traders focus only on the most relevant information.
- Adaptability: Whether you are a swing trader or a day trader, the ICT Panther can be adjusted to fit your trading style, offering robust and flexible tools for tracking market structure and order blocks.
- Institutional Edge: By identifying institutional-level order blocks and market structure breaks, traders using this indicator can trade in line with the strategies of large market participants.
Who Should Use the ICT Panther Indicator?
This indicator is ideal for:
- Crypto, Forex, and Stock Traders who want to incorporate institutional trading concepts into their strategies.
- Technical Analysts looking for precise tools to measure the market structure and price action.
- ICT Traders who follow the Inner Circle Trader methodology and want an advanced tool to automate and enhance their analysis.
- Price Action Traders seeking a reliable indicator to track pivot points, order blocks, and market structure breaks.
The ICT Panther Indicator is a powerful, versatile tool that brings institutional trading techniques to the fingertips of retail traders. Whether you are looking to identify key market structure breaks, order blocks, or crucial pivot points, this indicator offers detailed visualizations and customizable options to help you make more informed trading decisions. With its ability to track the activities of institutional traders, the ICT Panther Indicator equips traders with the insights needed to stay ahead of the market and trade with confidence.
With the ICT Panther Indicator, traders can follow the movements of institutional money, making it easier to predict market direction and capitalize on high-probability trading opportunities.
Enjoy it and share it with your friends!
